The Placer.ai Nationwide Office Building Index: The office building index analyzes foot traffic data from some 1,000 office buildings across the country. It only includes commercial office buildings, and commercial office buildings with retail offerings on the first floor (like an office building that might include a national coffee chain on the ground floor). It does NOT include government buildings or mixed-use buildings that are both residential and commercial.
RTO mandates seem to be everywhere. Following the federal government’s example, local governments from the City of Atlanta to the State of Texas have introduced stricter in-office requirements. And an increasing number of corporations are demanding full-time in-person work – including firms like JPMorgan, which began enforcing a five-day RTO mandate in early March.
But what does ground-level data tell us about how these new policies are affecting office attendance in practice? Did the RTO slowdown observed in January and February continue into March? Or is a new resurgence underway?
RTO Marches Ahead
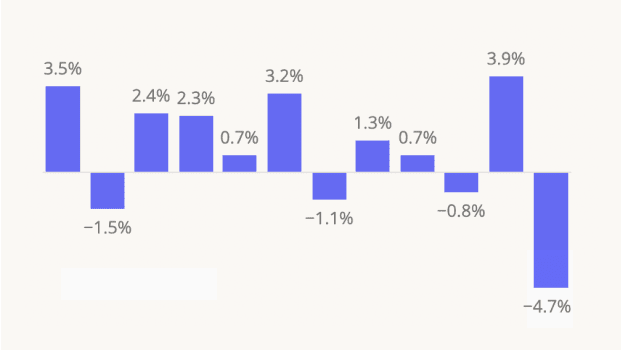
The latest data from the Placer.ai Office Index suggests that nationwide office visits may be trending upwards once again. Although March 2025 office visit levels didn’t match the peaks of October and July 2024, visits last month were only 32.2% below March 2019 levels – an improvement over March 2024.
Significantly, among months with 21 or fewer working days, March 2025 ranked as the second-busiest in-office month since the pandemic, just slightly behind October 2023 (October and July 2024 both had 22 days). So while January and February’s declining numbers hinted at a stalled market, March’s uptick suggests that lower office attendance earlier in the year may have been due to temporary factors like weather – and that the RTO may still be gaining momentum.
New York Still in the Lead
Diving into the data for eleven major business hubs nationwide shows New York and Miami once again at the head of the office recovery pack. Visits to NYC office buildings in March 2025 were just 11.4% below pre-pandemic (March 2019) levels – while Miami trailed by 17.3%. Meanwhile, Atlanta (-29.3%), Washington, D.C. (-30.6%), Dallas (-30.7%), and Houston (-31.0%) all outperformed the nationwide average of -32.2%. San Francisco tied in last place with Chicago, with visits 44.6% below 2019 levels.
YoY Upticks (Nearly) Across the Board
Turning to year-over-year (YoY) data, ten of the eleven analyzed cities experienced YoY office visit growth – led by Boston, with a 10.2% uptick. Washington, D.C. also recorded strong YoY gains (9.8%) – while San Francisco continued its recent positive momentum with a 9.6% increase. Los Angeles was the only city to see a minor (-2.2%) YoY visit lag – perhaps lingering fallout from the wildfires earlier this year.
More Gains Ahead?
Overall, the Placer.ai Office Index points to a renewed upswing in RTO momentum, likely driven by increasingly strict mandates from governments and corporations. Though persistent post-pandemic office visit gaps point to the continued prevalence of hybrid work, March’s noticeable uptick suggests that offices may be poised to make further gains in the coming months.
For more data-driven CRE insights, visit placer.ai/anchor


.png)
.png)

.png)
.png)


.svg)