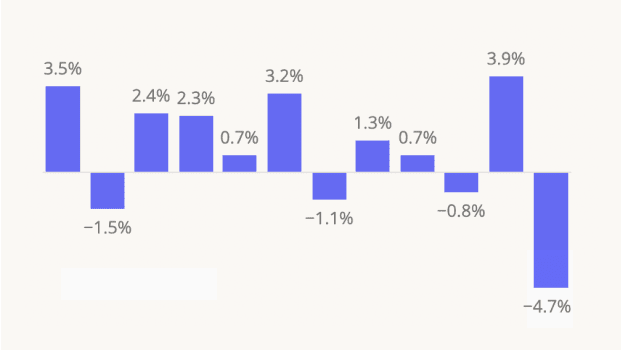
The Placer.ai Nationwide Office Building Index: The office building index analyzes foot traffic data from some 1,000 office buildings across the country. It only includes commercial office buildings, and commercial office buildings with retail offerings on the first floor (like an office building that might include a national coffee chain on the ground floor). It does NOT include mixed-use buildings that are both residential and commercial.
Just when we thought the return-to-office (RTO) debate was finally settled, things are heating up once again. Leading financial institutions like Goldman Sachs are requiring employees to come into the office five days a week (gasp!). And though research shows that remote-capable employees now live twice as far from the office as they did before COVID, some are now being asked to move back closer to the office and show up in person more often.
But what impact are these renewed skirmishes having on the ground? Has the office recovery needle begun to move once again? Or is all the talk merely that – talk?
We dove into the data to find out.
A Strong Leap Into 2024
Nationwide, visits to office buildings were down just 31.3% in February 2024 compared to February 2020 – the nation’s last “normal” in-office month before COVID changed everything. This relatively narrow year-over-four-year (Yo4Y) visit gap may be partially due to this year’s February leap day: Last month had 20 working days, compared to just 19 in February 2020 and 2023. (2020 was also a leap year, but the extra day fell on the weekend.)
Still, office visits in February 2024 were also higher than in January 2024, when unusually cold and stormy weather stranded many Americans at home. And year over year (YoY), February 2024 visits were up 18.6% – which, even accounting for the month’s extra day, points towards significant growth.
Regional Round Robin
Taking a look at city-wide trends shows the persistence of significant regional variation – with Miami and New York continuing to lead the post-COVID office recovery pack, and San Francisco bringing up the rear. Dallas, Atlanta, and Washington, D.C. also outperformed the nationwide Yo4Y baseline of -31.3%. And of the cities that continued to lag behind, Chicago, Boston, and San Francisco all outpaced the national average for YoY visit growth.
Here, too, February 2024’s additional business day did some of the work. Nevertheless, urban centers like Miami and New York – where office visits were down just 9.4% and 14.5%, respectively, compared to February 2020 – are clearly experiencing accelerated recovery. In Miami, an influx of tech companies may be contributing to the narrowing foot traffic gap – while in New York, the finance sector is likely a major driver of visit growth. And though San Francisco continues to lag behind other cities, the tech hub’s impressive YoY foot traffic increases indicate real change on the ground.
Key Takeaways
Hybrid work may be here to stay – but February’s office foot traffic data appears to indicate that companies and employees are still feeling out the ideal balance between RTO and WFH. And whether due to growing demands by employers or workers’ own concerns about the possible deleterious effects of fully remote work on their careers, further office recovery may yet be on the table.
How will RTO progress as 2024 gets into full swing? Will New York and Miami close the gap? And what will happen in San Francisco?
Follow Placer.ai’s data-driven office recovery analyses to find out.
This blog includes data from Placer.ai Data Version 2.0, which implements improvements to our extrapolation capabilities, adds short visit monitoring, and enhances visit detection.


.png)
.png)

.png)
.png)


.svg)