2024 has been a good year for fast-casual restaurants. Limited-time offers notwithstanding, rising QSR prices have narrowed the price gap between fast food and the more premium offerings of chains like Chipotle and sweetgreen. And with many fast-casual restaurants upping their convenience games with drive-thrus and other innovations, the distinction between the two segments has become increasingly muddied.
So with summer winding down, we dove into the data to explore segment-level consumer behavior at quick-service and fast-casual restaurants. How are they performing this year? And do consumers still interact differently with the two categories?
We dove into the data to find out.
Fast-Casual Rocks Weekdays
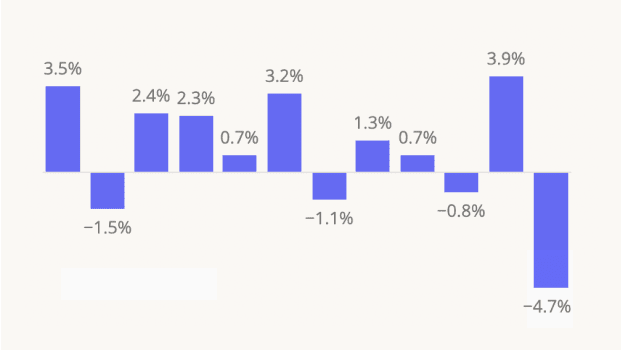
During the first half of 2024, fast-casual restaurants experienced 3.2% year-over-year (YoY) visit growth, while QSR held steady with a minor 0.4% uptick. As QSR favorites have gotten pricier, some budget-conscious diners have responded by trading up – embracing elevated fast-casual experiences that hit the sweet spot between quality and affordability.
Drilling down deeper into the data, however, paints a more nuanced picture. On weekends, both QSRs and fast-casual chains experienced positive YoY visit growth (2.1% and 4.0%, respectively) – a significant difference, but not a tremendous one. On their days off, it seems, Americans are opting for a variety of value-oriented indulgences, and both segments are benefiting.
But on weekdays, fast-casual foot traffic grew by 2.8%, while QSR visits declined slightly by 0.2%. As the return-to-office (RTO) continues apace, more affluent office workers may be driving a weekday fast-casual renaissance.
QSR Close to Home – Fast-Casual at the Office?
A look at driving distances to QSR and fast-casual restaurants provides further evidence that commuters may be contributing to fast-casual’s weekday YoY visit growth.
In H1 2024, a higher share of QSR visits came from customers hailing from CBGs less than two miles away from the restaurants – suggesting that QSR visitors were more likely to frequent local, neighborhood venues. Meanwhile, a significantly higher percentage of fast-casual visits (63.6%) originated from CBGs between two and 30 miles away, compared to just 56.8% for QSR. These less-local visitors may be stopping by a fast-casual establishment during their lunch break or after work, on days when they commute to the office.
Interestingly, QSRs and fast-casual restaurants drew similar shares of visitors from CBGs more than 30 miles away – perhaps suggesting that when traveling, consumers enjoy frequenting both segments.
The $75K-$100K Sweet Spot
Given fast-casual’s higher-quality offerings, it may come as no surprise that these chains tend to attract a more affluent clientele than their QSR counterparts. During the first half of 2024, the Census Block Groups (CBGs) feeding visitors to QSRs (i.e. their captured market) had a weighted median household income (HHI) of $65.7K – compared to $78.0K for fast-casual chains.
But medians only tell a part of the story – and a closer look at the segments’ visitor bases reveals a striking similarity between them: In H1 2024, the two categories’ captured markets featured nearly equal shares of a key demographic – households earning between $75K and $100K per year. This group includes both average-income families and those with a bit more money to spend. (According to STI:PopStats, the nationwide median HHI stands at $76.1K). And the ability of both quick-service restaurants and fast-casual chains to attract these consumers shows that despite their differences, the two segments do overlap – and both have plenty to offer today’s consumers.
Looking Ahead
Despite still-high prices, consumers are finding room in their budgets for affordable splurges – and fast-casual restaurants and QSRs (at least on weekends) are benefiting. How will the two segments continue to fare in the upcoming holiday season? And will their demographic middle ground expand as the line between the two categories continues to blur?
Follow Placer.ai’s data-driven restaurant analyses to find out.
This blog includes data from Placer.ai Data Version 2.1, which introduces a new dynamic model that stabilizes daily fluctuations in the panel, improving accuracy and alignment with external ground truth sources.


.png)
.png)

.png)
.png)


.svg)