Thanks for Visiting!

Register for free to get the full story.

Sign Up
Already have a Placer.ai account? Log In
Retail

Boot Barn and DSW: Stepping Up Their Game

Dive into the data to see how Boot Barn and DSW fared in Q3 2024 – and what they can expect this holiday season.

By 
Maytal Cohen
October 24, 2024
Boot Barn and DSW: Stepping Up Their Game
SHARE
Explore our free tools to get timely insights into key industries
Check out the latest trends for
Key Takeaways
  • In Q3 2024, Boot Barn and DSW experienced year-over-year (YoY) visit growth of 10.8% and 10.5%, respectively.
  • Despite smaller stores, Boot Barn experiences longer visitor dwell times than DSW – perhaps due to the chain’s more varied merchandise and firmer positioning as a weekend destination. Still, visitors to both brands tend to remain in-store, on average, for more than 30 minutes.
  • Boot Barn and DSW experience the holiday season differently: Boot Barn sees its biggest seasonal visit spikes in November and December, while DSW draws its biggest crowds in the spring. But for both chains, Black Friday remains the busiest day of the year.

The holiday shopping season is nearly upon us – and one category that always benefits from holiday sales is apparel. So with Q4 underway, we checked in western wear leader Boot Barn and discount footwear chain DSW (Design Shoe Warehouse, owned by Designer Brands, Inc.) to see how they fared in Q3 2024 – and what awaits them as Black Friday approaches. 

A Step Up in Visits

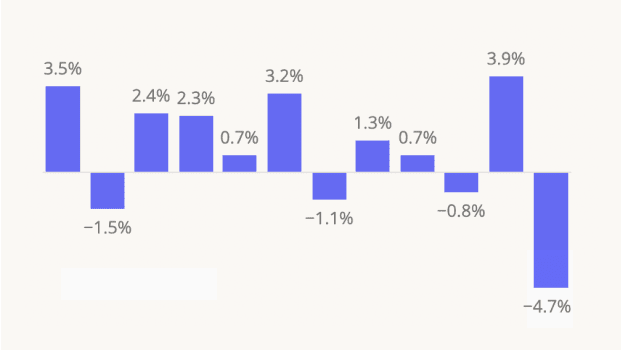
Boot Barn and DSW – two very different shoe retailers – have been thriving in recent months. Since May 2024, the two chains have seen sustained monthly year-over-year (YoY) visit growth, finishing out Q3 2024 with visit upticks of 10.8% (Boot Barn) and 10.5% (DSW). 

For Boot Barn in particular, Q3’s robust visit growth was at least partially driven by the chain’s aggressive expansion strategy: Between July 2023 and June 2024, Boot Barn opened some 50 new stores – and plans to open dozens more over the coming year. But foot traffic data also shows that the chain has succeeded in growing its footprint without significantly diluting traffic at existing locations. During Q3, the average number of visits to each Boot Barn location dipped just slightly below 2023 levels (2.8%), even as YoY visits to the chain surged by 10.8%. 

DSW, for its part saw significant YoY visit growth throughout Q3, despite a store count that has remained relatively stable. As a store that offers shoppers access to high-quality, name-brand products at affordable prices, DSW lets consumers trade down while splurging at the same time. 

Size Isn’t Everything

DSW isn’t called a warehouse for nothing. The typical DSW store spans about 25,000 square feet (though the chain has begun experimenting with smaller formats) – compared to just 12,000 - 14,000 for Boot Barn. But despite the smaller size of Boot Barn’s locations, visitors to the western wear chain tend to spend more time in-store than visitors to DSW. Since 2022, average visitor dwell times at Boot Barn have ranged between 34.9 and 35.8 minutes, while dwell times at DSW have hovered between 32.1 and 32.8 minutes. 

Customers at DSW may be more likely to know in advance what they’re looking for, making a bee-line for the discounted footwear they’ve been waiting to get their hands on. Visitors to Boot Barn, on the other hand, may spend more time browsing the brand’s wider selection of merchandise. 

The difference in visitor dwell times may also be partially due to Boot Barn’s firmer positioning as a weekend destination: Over the past twelve months (October 2023 - September 2024), 59.5% of visits to Boot Barn took place between Fridays and Sundays, compared to 56.3% for DSW. 

Still, visitors to both chains tend to remain in-store for more than half an hour – revealing a highly engaged customer base eager to explore the brands’ varied offerings. 

Different Seasonal Rhythms

With a strong Q3 2024 under their belts, what can DSW and Boot Barn expect this holiday season? 

Looking at weekly fluctuations in visits to Boot Barn and DSW in 2022 and 2023 – compared to yearly weekly averages – reveals another striking difference between the two chains: Visits to Boot Barn peak in November and December each year, as customers descend upon the chain to purchase western-themed gifts for loved ones. DSW, on the other hand, sees greater visit boosts in spring, perhaps buoyed by shoppers updating their wardrobes in anticipation of warmer weather.

But zooming in on the two chains’ busiest days of the year tells a somewhat different story. Even though DSW experiences a more muted holiday shopping season, the shoe leader – like Boot Barn – draws its biggest crowds of the year on Black Friday. On November 24th, 2023, visits to DSW jumped 134.5% compared to the chain’s daily average for the 12-month period from October 2023 to September 2024 – a smaller spike than that seen by Boot Barn, but significant nonetheless. 

After that, however, the chain’s visitation patterns diverged. For DSW, the next eight busiest days of the year were all Saturdays in Spring – including the Saturday before Mother’s Day (May 11th) and the Saturday before Easter (March 30th). For Boot Barn, on the other hand, December shopping days – including Super Saturday (December 23rd) – drove the biggest foot traffic spikes. 

A Slice of Success

With holiday shopping just around the corner, DSW and Boot Barn both appear poised to enjoy a healthy Q4 – each in their own way. Which other footwear and apparel brands are likely to succeed this holiday season? 

Follow Placer.ai's data-driven retail analyses to find out.

This blog includes data from Placer.ai Data Version 2.1, which introduces a new dynamic model that stabilizes daily fluctuations in the panel, improving accuracy and alignment with external ground truth sources.

Learn how downtown regions across US cities are measuring up with our free tools.
Check out the latest trends for
Explore our free tools to get timely insights into key industries
Check out the latest trends for
SHARE
Get 3 brand & industry
breakdowns every week
Subscribe to the newsletter
Oops! Something went wrong while submitting the form.

Get a Demo

Please enter your first name
Please enter your last name
Please provide a valid email
Please enter your email
Please enter company name

Thanks for reaching out!

One of our experts will be in touch soon

Try Placer.ai Free
Oops! Something went wrong while submitting the form.

Recent Publications

Get 3 brand & industry breakdowns every week

Subscribe to the newsletter
Text Link
Boot Barn
Text Link
Holiday Season
Starbucks’ Red Cup Day Makes a Comeback 
Eatertainment in Q3 2024: Dave & Buster’s and Chuck E. Cheese
Dollar Stores Ahead of the Holidays
Five Below and Ollie’s Bargain Outlet: A Pre-Holiday Snapshot
Kroger: Getting into The Seasonal Swing 
Avison Young Launches Office Busyness Index Powered by Placer.ai to Provide Unmatched Insights on Office Utilization Across Major U.S. Markets
Off-Price Ahead of the 2024 Holiday Season
A Beautiful Season Ahead: Ulta and Sally Beauty Supply
Sportswear Ahead of the 2024 Holiday Season 
Placer 100 Index: October 2024 Recap 
Placer.ai Office Index: October 2024 Recap
Placer.ai Mall Index: October 2024 Recap 
Halloween’s 2024 Retail & Dining Impact – Party City Carries the Season
Checking in With Department Stores: Nordstrom and Macy’s
Superstores and Wholesale Clubs Ahead of the Holidays
Home Depot and Lowe’s Heading Into the Holidays
Starbucks and Dutch Bros: Short Visits Lead the Way
Planet Fitness: Raising the Bar(bell)
Checking in With Full-Service Restaurants: First Watch, Chili’s, and Outback Steakhouse
RBI and Yum!: QSR Resilience in 2024
Boot Barn and DSW: Stepping Up Their Game
Target’s October Circle Week: A Data-Driven Snapshot
Chipotle, Shake Shack & Wingstop: Dining Success in Q3 2024
Playa Bowls and Tropical Smoothie Cafe: Berry Big Business
Cheesecake Factory & BJ’s Restaurants: Full-Service Success
Checking in on McDonald's and Wendy's 
Sprouts Farmers Market: A Specialty Grocer With a Traditional Twist
CAVA: The Craze Continues
Placer.ai Reaches $100M Annual Recurring Revenue
Catching Up With Carter's 
A Texas Roadhouse and LongHorn Steakhouse Showdown
Placer.ai Mall Index: September 2024 Recap – Labor Day Peaks and Holiday Season Predictions
Albertsons Q3 Check-In
Looking Ahead to the 2024 Holiday Season
Trader Joe's: Continuing to Thrive in 2024
Bowlero and AMF: A Ten-Pin Knockout
Recreational Retail: Store Performance in 2024
Placer.ai White Paper Recap – September 2024
A QSR and Fast-Casual Face-Off
Sam’s Club’s In-Store Retail Media Network Opportunity
The Rising Stars: Six Metro Areas Welcoming Young Professionals
Costco in 2024: A Deep Dive
Sherwin-Williams in 2024: Brighter Than a New Lick of Paint
Life Time and Orangetheory: Premium Fitness Flourishing
C-Stores: More Than A Pit Stop
Darden: Dining Dominance Undeterred 
Placer 100 Index for Retail and Dining: August 2024 Recap
Placer.ai Office Index: August 2024 Recap
Placer.ai Mall Index: August 2024 Recap – Back-To-School In Full Swing
Auto Parts Retailers: The Traffic Continues
Pumpkin Spice Works its Magic Once Again
School Season Sparks Retail Growth
Placer.ai White Paper Recap – July & August 2024
Big Lots’ Big Rightsizing Move in Four Data Points
Fun Away From The Sun: Checking in With Eatertainment
Domestic Migration and Population Growth: Strong Currents Off The Carolina Coast
The Civic Impact of Summer Events
Retail Trends in College Towns: A Back-to-School Snapshot
Five Below and Ollie’s Bargain Outlet: Consumers Still on the Hunt for Discounts
Macy’s & Bloomingdale’s: Into 2024 and Beyond
Limited Time Only: The Trend Continues
Beauty in 2024: Many Ways to Win
Dollar General & Dollar Tree: Powering Ahead in Q2 2024
The Home Depot and Lowe's Foot Traffic Remodel in Q2 2024
Superstore Update: Summer Savings Spree
Placer.ai Mall Index: July 2024 Recap – From Fourth of July to Back-to-School
Placer.ai Office Index: July 2024 Recap
Summer Movie Madness: Blockbuster Films Boost Foot Traffic
Driving Success: Toyota in 2024
Denny’s and IHOP: An All-Day Breakfast Matchup
Warby Parker: Seeing Clearly Now
Planet Fitness at the 2024 Halfway Point
Serving Summer 2024: RBI and Yum! Brands Q2 Foot Traffic
Starbucks, Dutch Bros., Dunkin’: Finding Summer Success
Fast Food and Fast Casual Favorites, Plus CosMc’s Takeoff
Chipotle and Sweetgreen: Fast-Casual in Q2 2024
First Watch, Texas Roadhouse, and Applebee’s: An FSR Roundup
Albertsons Companies: H1 2024 Recap
Teaming Up For Success: Sports Stadium Sponsorships
Limited Time Offers: Price Wars Boost Visits
Placer 100 Index for Retail & Dining: June 2024 Recap
Placer.ai Mall Index: June 2024 Recap
Placer.ai Office Index: June 2024 Recap
Inside Out 2: The New Blockbuster Bringing Crowds Back to Theaters
Petco and PetSmart: A Head to Head
Frozen Delights: Exploring Ice Cream Chains Across America
Placer.ai White Paper Recap – June 2024
Barnes & Noble: Writing a New Story
Small Format Stores - Sprouting, Blooming, and Expanding
Retail and Dining on Father’s Day
Thrift Store Visit Scores
Charting Value Grocery’s Visit Growth
Placer 100 Index for Retail & Dining: Introduction and May 2024 Recap
Digging Into Darden: Q2 2024 Update
2024 Retail and Dining Trends Update
TRU and avid: Midscale Hotels on the Rise 
Diving Into Kroger: A Strong Start to 2024
Placer.ai Mall Index: May 2024 Recap – Mall Visits on the Rebound
Placer.ai Office Index: May 2024 Recap
2024 Memorial Day Recap