Fast-casual dining chain CAVA has had a great few years. The restaurant chain, which serves up health and flavor-forward Mediterranean fare, has increased its footprint massively over the past few years, and shows no signs of slowing down.
We took a closer look at the location intelligence data to understand what is driving success for the fast-casual dining chain.
Monthly Visits Outpace Overall Fast-Casual Visits
CAVA, which has been opening restaurants at a rapid clip, is firmly in expansion mode. The restaurant chain featured 341 restaurants at the end of Q2 2024 – up from roughly 300 at the end of 2023 – and has set its sights on operating 1,000 locations by 2032.
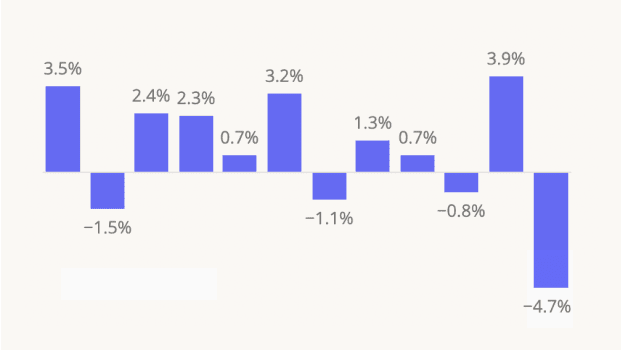
Partly as a result of its growing footprint, CAVA’s foot traffic – already elevated in 2023 – has continued to surge throughout 2024. The chain achieved double-digit year-over-year (YoY) visit growth during every month of the year so far, with September visits up 24.9% YoY. By comparison, the broader fast-casual dining sector – which is also thriving – saw more modest YoY visit growth over the same period, as well as some minor YoY declines in January and September.

Visit-Per-Location Growth Cements CAVA’s Positioning
Still, though much of CAVA’s YoY foot traffic growth may be attributed to its rapid expansion – after all, more restaurants mean more opportunities for diners to try a lemon chicken or harissa avocado bowl – CAVA’s individual locations are also drawing more traffic. In all but one month of 2024 – January, when inclement weather led to a retail slowdown nationwide – the average number of visits to each CAVA restaurant also rose significantly. And in August and September 2024, visits per location grew by 15.0% and 9.9% YoY, respectively.
These trends suggest that CAVA’s expansion strategy is leaning into robust demand – and has succeeded in generating excitement and visit growth in both new and existing markets.

Visits Democratizing
One factor that may be helping CAVA drive traffic is the growing diversity of its customer base. Analyzing changes in CAVA’s captured market over time with demographics from STI: PopStats shows that the median household income (HHI) of the brand’s visitor base has dropped over the past few years. (A chain’s captured market is obtained by weighting each census block group (CBG) in its trade area according to its share of visits to the chain in question – and thus represents the profile of the business’ actual visitor base.) In Q3 2021, the median HHI of CAVA’s captured market was $107.5k – much higher than the nationwide median of $76.1K. But as the chain has expanded, the median HHI of its visitor base has steadily declined, reaching $92.3K by Q3 2024.
Similarly, using the Spatial.ai: PersonaLive dataset to look at the psychographic makeup of CAVA’s trade areas reveals that the share of “Ultra-Wealthy Families” in the chain’s captured market has also declined – from 22.9% 2021 to 17.1% in 2024. At the same time, the share of “Young Urban Singles” grew from 5.4% to 7.3%.
This shift suggests that as CAVA expands, it is welcoming a broader and more diverse customer base – positioning it for continued growth as it opens new locations.

CAVA’s Success Continues
CAVA continues to exceed expectations, opening stores at a rapid clip while maintaining visit numbers and appealing to an ever-growing range of customers.
What might the final quarter of the year hold in store for the fast-casual chain?
Visit Placer.ai to keep up to date with the latest data-driven dining insights.
This blog includes data from Placer.ai Data Version 2.1, which introduces a new dynamic model that stabilizes daily fluctuations in the panel, improving accuracy and alignment with external ground truth sources.


.png)
.png)

.png)
.png)


.svg)