All-day breakfast mainstays Denny’s and IHOP (owned by Dine Brands) are two of the most popular full-service restaurants (FSRs) in the United States. But though the chains occupy similar niches, there are some differences between them. We dove into the data to check in with the two breakfast leaders – and see how they stack up against one another on key visitation metrics.
Similar Visit Shares and Foot Traffic Trajectories
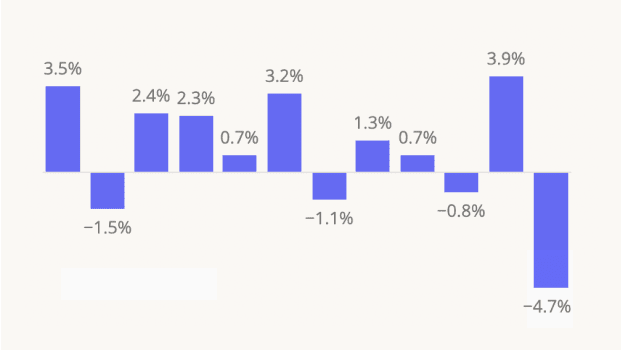
Both Denny’s and IHOP are major players in the FSR space. With its somewhat larger footprint, IHOP captured 6.0% of visits to full-service restaurant chains in the U.S in H1 2024, while Denny’s captured 5.0%. And despite the headwinds that continued to weigh on the sector this year, both chains saw modest YoY foot traffic gains in May and June 2024.
(The relatively big YoY fluctuations that both chains experienced in March and April 2024 are likely due in part to calendar shifts: March 2024 had one more weekend than March 2023, while April 2024 had one fewer weekend than April 2023. The two chains’ YoY June performance was also likely buoyed by an extra weekend in June 2024.)
(Somewhat) Different Audiences
Who are IHOP’s and Denny’s typical customers? Given the two diners’ affordable offerings, it may come as no surprise that both restaurants draw visitors from captured markets with median household incomes below the nationwide baseline of $76.1K – $67.5K for Denny’s and $69.2K for IHOP.* Both chains also draw substantial shares of customers from Blue Collar Suburbs.
But each breakfast leader also draws a unique mix of visitors from a range of segments – with Denny’s attracting higher shares of middle-class urbanites and IHOP attracting higher shares of wealthy and upper-middle-class suburbanites.
Wealthy Suburban Families, for example, made up 9.5% of IHOP’s captured market and 8.1% of Denny’s in H1 2024 – while Young Urban Singles made up 10.5% of Denny’s captured market and 9.2% of IHOP’s. And while Denny’s visitors were more likely to hail from middle-class Near-Urban Diverse Families, IHOP visitors were more likely to be from upper-middle-class Upper Suburban Diverse Families.
The ability of both chains to attract a wide variety of audiences across economic strata is an important factor in their success and staying power.
*Based on STI: PopStats, combined with Placer.ai trade area data for January-June 2024.
Different Calendar Milestones
Plenty of people eat at all-day breakfast chains on a regular basis: In June 2024, for example, 16.9% and 14.1% of visitors to Denny’s and IHOP, respectively, frequented the chains at least twice during the month. But for both restaurants, holidays and other special milestones – including Christmas, Mother’s Day, Father’s Day, and Veteran’s Day – drive major visit spikes.
Here too, however, the data reveals important differences between the two chains. Generally speaking, IHOP’s special-occasion visit boosts (compared to annual daily averages) are more substantial than those of Denny’s. And while for Denny’s, Christmas Day is the busiest day of the year, for IHOP, Mother’s Day reigns supreme. And Veteran’s Day – which both IHOP and Denny’s mark with free meals for current and former servicemen and women – is more important for IHOP than for Denny’s.
Similar Weekly Rhythms – With Some Nuances
A look at the daily and hourly breakdown of visits to IHOP and Denny’s shows that the two chains also follow similar visitation patterns – but with a twist. For both restaurants, Sunday morning between 10:00 AM and 1:00 PM is the single most busiest daypart of the week – when many customers likely visit the chains to enjoy leisurely weekend brunches. Predictably, the 10:00 AM to 1:00 PM daypart is also bustling for both breakfast brands throughout the rest of the week.
But though IHOP and Denny’s both have many restaurants that are open 24/7, Denny’s sees a greater share of evening and late night visits than IHOP – perhaps reflecting the chain’s recent push to increase the number of locations open in the wee hours. Between January and June 2024, Friday and Saturday evenings between 10:00 PM and 1:00 AM drew 2.3% and 2.5%, respectively, of weekly visits to Denny’s – compared to just 1.6% and 1.7%, respectively, for IHOP.
Breakfast Buddies
IHOP and Denny’s are two of the most important FSR chains on the category landscape. And location analytics shows that there’s plenty of room at the top for both chains, which despite similar offerings serve audiences with somewhat different profiles and behaviors.
For more data-driven restaurant insights, follow Placer.ai.


.png)
.png)

.png)
.png)


.svg)