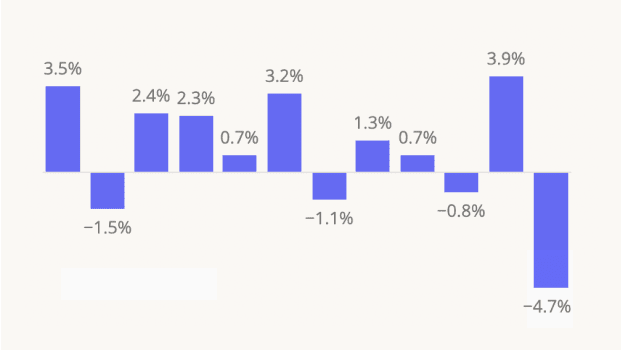
The Placer.ai Nationwide Office Building Index: The office building index analyzes foot traffic data from some 1,000 office buildings across the country. It only includes commercial office buildings, and commercial office buildings with retail offerings on the first floor (like an office building that might include a national coffee chain on the ground floor). It does NOT include mixed-use buildings that are both residential and commercial.
Has the remote work war run its course? For a while last year, it seemed like not a day went by without another headline proclaiming the demise of WFH. And as return-to-office mandates continued to pile up (et tu, Zoom?), the debate over offsite work productivity grew ever more rancorous.
But amidst all the noise, a new hybrid reality appears to have taken hold, offering both companies and employees the benefits of a mixed model. Yes, productivity can thrive outside the office – but there is something about the intangible spark that ignites when people interact with one another in person that has proven crucial to business success. So while recent survey data shows a precipitous drop in fully remote work over the past three years, most companies aren’t requiring people to go back to the office full time.
With these trends in mind, we dove into the data to explore the state of office foot traffic as the year drew to a close. How did December 2023 office visits compare to pre-COVID? And what impact did the holiday season have on the demographic profile of the typical office-goer?
December Holding Pattern Amidst Regional Differences
Last month, buildings in our Nationwide Office Index received 36.5% fewer visits than they did in December 2019 – reflecting a continuation of the same general holding pattern that has seen foot traffic hovering around 40.0% of pre-COVID levels, with some minor fluctuations.
But delving further into the data for key commercial hubs nationwide highlights the persistence of important regional differences – with New York City emerging as last month’s clear office recovery winner. In December 2023, the Big Apple experienced a year-over-four-year (Yo4Y) visit gap of just 19.2% – the smallest seen by the city in some time. At the other end of the spectrum lay San Francisco, with a Yo4Y visit gap of 53.1%.
.png)
Who Goes to the Office in December?
But December is a bit of an outlier, work-wise. It’s the heart of the holiday season – kicked off by Thanksgiving at the end of November, and bookended by New Year’s Eve on the other side. And foot traffic data shows a small but distinct shift in the demographic profiles of office buildings’ captured markets – i.e. the areas their visitors come from – during the last month of the year.
Nationwide, and in major cities like New York and San Francisco, office-goers tend to come from relatively affluent areas with greater-than-average shares of one-person households. But over the final three months of 2023, both of these metrics in office buildings’ captured markets gradually declined. November office visitors were more likely to come from larger and lower-HHI households than October visitors – and December visitors were more likely to come from such households than November ones. This may reflect the greater flexibility of higher-HHI employees to work from home more often during the holiday season. It may also reflect a greater tendency on the part of singles to take extended trips to visit family during the holidays, and plug in from afar.
.png)
Key Takeaways
Hybrid work may be here to stay, but employees and companies will likely continue to negotiate the exact terms of the new model in the months and years ahead. Are the remote work wars really over? And what will office recovery look like in the new year?
Follow placer.ai/blog to find out.


.png)
.png)

.png)
.png)


.svg)