Walmart-owned Sam’s Club has been investing in its own independent retail media network (RMN) – Sam’s Club Members Access Platform (MAP) – for quite some time. This past summer, the RMN launched opt-in display ads in the “Scan & Go” self-checkout feature on the Sam’s Club mobile app, turning any mobile device into an in-club media channel for the chain.
We dove into the latest location analytics for Sam’s Club to understand how in-store foot traffic could drive the success of Scan & Go ads in the chain’s largest markets.
Discovery with “Scan & Go”
Scan & Go aims to enhance the shopping experience by suggesting product pairings for already-scanned items. The feature’s high adoption rate and frequent usage among Sam’s Club members contributes to its potential as a highly successful advertising channel. And location data indicates that the feature has the ability to attract a growing number of eyeballs.
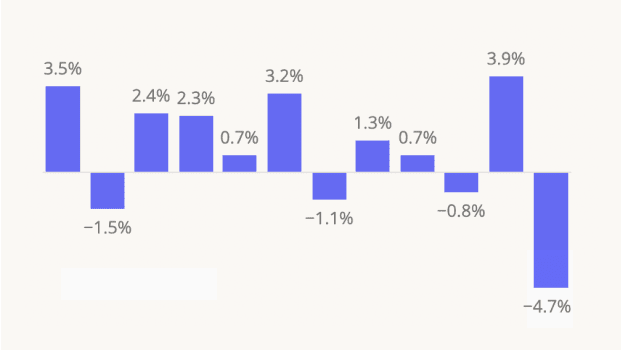
Nationwide, Sam’s Club drew 5.1% more unique visitors during the first eight months of 2024, and 6.2% more overall visits, than in the equivalent period of 2023. In Texas, the state with the most Sam’s Club locations, the chain saw even more impressive year-over-year (YoY) unique visitor (6.9%) and visit (7.9%) growth – which could add to the appeal of advertising through Scan & Go in the Lone Star State. Meanwhile, Florida – Sam’s Club’s second-biggest market – saw YoY visit and unique visitor growth slightly below the nationwide baseline. But in the Sunshine State, too, the chain saw significant YoY jumps in visits and unique visitors – and experienced longer average dwell time than the chain’s nationwide average.
Different Markets and Audiences
Diving into the audience segmentation of Sam’s Club’s trade areas in Texas and Florida reveals how each state offers a unique advertising opportunity to the brand’s retail media partners.
Between September 2023 and August 2024, the Sam’s Club’s Texas captured market had a higher share of families with children (31.1%) than its Florida one (24.7%), highlighting the chain’s greater reach among this demographic in the Lone Star State. But parental households are generally more common in Texas than Florida – and while Sam’s Club’s Texas markets were under-indexed for this demographic compared to the statewide baseline, the chain’s Florida markets were over-indexed for it compared to the Sunshine State’s lower baseline. So for advertisers seeking to reach Florida households with children, Sam’s Club offers a particularly enticing opportunity to do so.
Meanwhile, Sam’s Club’s Texas captured market featured a higher share of “Near-Urban Diverse Families” (8.6%) than the statewide baseline of 6.2%, while the brand’s Florida market had a slightly smaller share of the segment (6.2%) than the statewide baseline (7.3%). Texas Sam’s Club locations, it seems, offer more focused access to this demographic – both in absolute terms, and in relation to statewide baselines.
The Right Time For Retail Media
Looking closely at weekly visitation patterns to Sam’s Club in Texas and Florida provides further insight into the ideal timing for engagement with the brand’s RMN.
Between September 2023 and August 2024, the busiest days at Sam’s Club in both Florida and Texas were Saturdays and Sundays. However, Texas locations had a greater share of its weekend visits between 4:00 PM and 6:00 PM, while Florida saw a greater share of its weekend traffic between 10:00 AM and 1:00 PM.
An understanding of these patterns could help advertisers and Sam’s Club predict the potential for Scan & Go usership at specific times – offering insight into strategies and pricing methods that account for peak visitation times.
Where Could Scan & Go, Go?
At present, Scan & Go display ads are available at all Sam’s Club’s stores, but only to select members – which means the potential engagement and revenue streams driven by the new feature have yet to be fully realized. And as Scan & Go display ads achieve success, the chain may explore additional enhancements to its multi-channel RMN.
For updates and more retail foot traffic insights, visit Placer.ai.
This blog includes data from Placer.ai Data Version 2.1, which introduces a new dynamic model that stabilizes daily fluctuations in the panel, improving accuracy and alignment with external ground truth sources.


.png)
.png)

.png)
.png)


.svg)