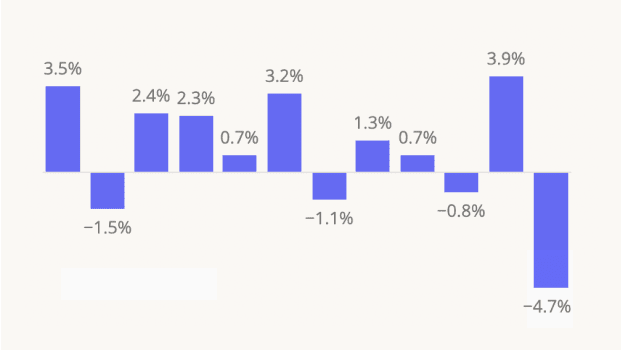
Visits to the home improvement segment thrived during the pandemic, then slowed as high interest rates and rising prices led many consumers to defer big projects. But paint and coating giant Sherwin-Williams has displayed a special resilience, driving visits in what remains a challenging environment for the category.
With prime relocation season winding down, we dove into the foot traffic and audience segmentation data for the chain to uncover the trends that might be behind Sherwin-Williams’ recent success.
A Splash of Seasonality
Paint and coating giant Sherwin-Williams Company is having a moment. After reporting stronger-than-expected earnings last quarter, the company raised its full-year outlook for 2024. And foot traffic to the company’s eponymous chain, where many of its products are sold exclusively, has been on an upswing.
Since the start of the year, Sherwin-Williams has seen consistently more robust visit growth than the wider home improvement segment compared to an August 2019 baseline – except in May 2024, when home improvement stores see their biggest annual visits spikes. In August 2024, visits to Sherwin-Williams were up 12.4% compared to an August 2019 baseline, while the broader category saw a minor decline of 2.1%.
According to a recent report by Sherwin-Williams management, the company has been outpacing the home improvement category in sales related to new residential projects. And with new home sales beginning to pick up steam, they could be playing a role in Sherwin-Williams’ recent visit surge.
Sherwin-Williams’ outsized August visit growth may also be due in part to its unique seasonal visit patterns. While home improvement chains usually enjoy a major spring foot traffic spike in May, as consumers take on fair-weather projects, Sherwin-Williams sees more prolonged visit boosts lasting throughout the spring and summer – and since 2023 has experienced pronounced upticks in May and August. As a paint store, Sherwin-Williams likely benefits from summer relocations – the period between mid-May and mid-September is the most popular time for moves in the U.S., which often require residences to be repainted.
Median HHI: Peeling Back The Layers
Diving deeper into the segmentation of Sherwin-Williams’ customer base reveals another factor that could be behind the company’s recent success.
Analyzing Sherwin-Williams’ potential market with data from STI: PopStats shows that the chain is positioned to serve average-income consumers, with median household incomes (HHIs) just under the nationwide baseline of $76.1K. But though the median HHI of Sherwin-Williams’ potential market declined slightly over the past several years, the median HHI of its captured market has increased. (A chain’s potential market refers to its overall trade area, weighted to reflect the size of each Census Block Group (CBG) therein. A chain’s captured market, on the other hand, is obtained by weighting each CBG according to its share of visits to the chain in question, and thus reflects the characteristics of the chain’s actual visitor base.)
This indicates that Sherwin-Williams is doing an especially good job this year at driving traffic from areas within its markets that feature larger shares of higher-income residents – those likely to be moving into a new home or renovating.
The Finishing Touches
Will Sherwin-Williams’ impressive foot traffic growth continue in the months ahead? If shelter inflation indeed eases, as some analysts suspect, more consumers may be inclined to repaint their homes or upgrade their living situation altogether – driving even more demand for the brand.
For updates and more retail foot traffic insights, visit Placer.ai.
This blog includes data from Placer.ai Data Version 2.1, which introduces a new dynamic model that stabilizes daily fluctuations in the panel, improving accuracy and alignment with external ground truth sources.


.png)
.png)

.png)
.png)


.svg)